Statewide
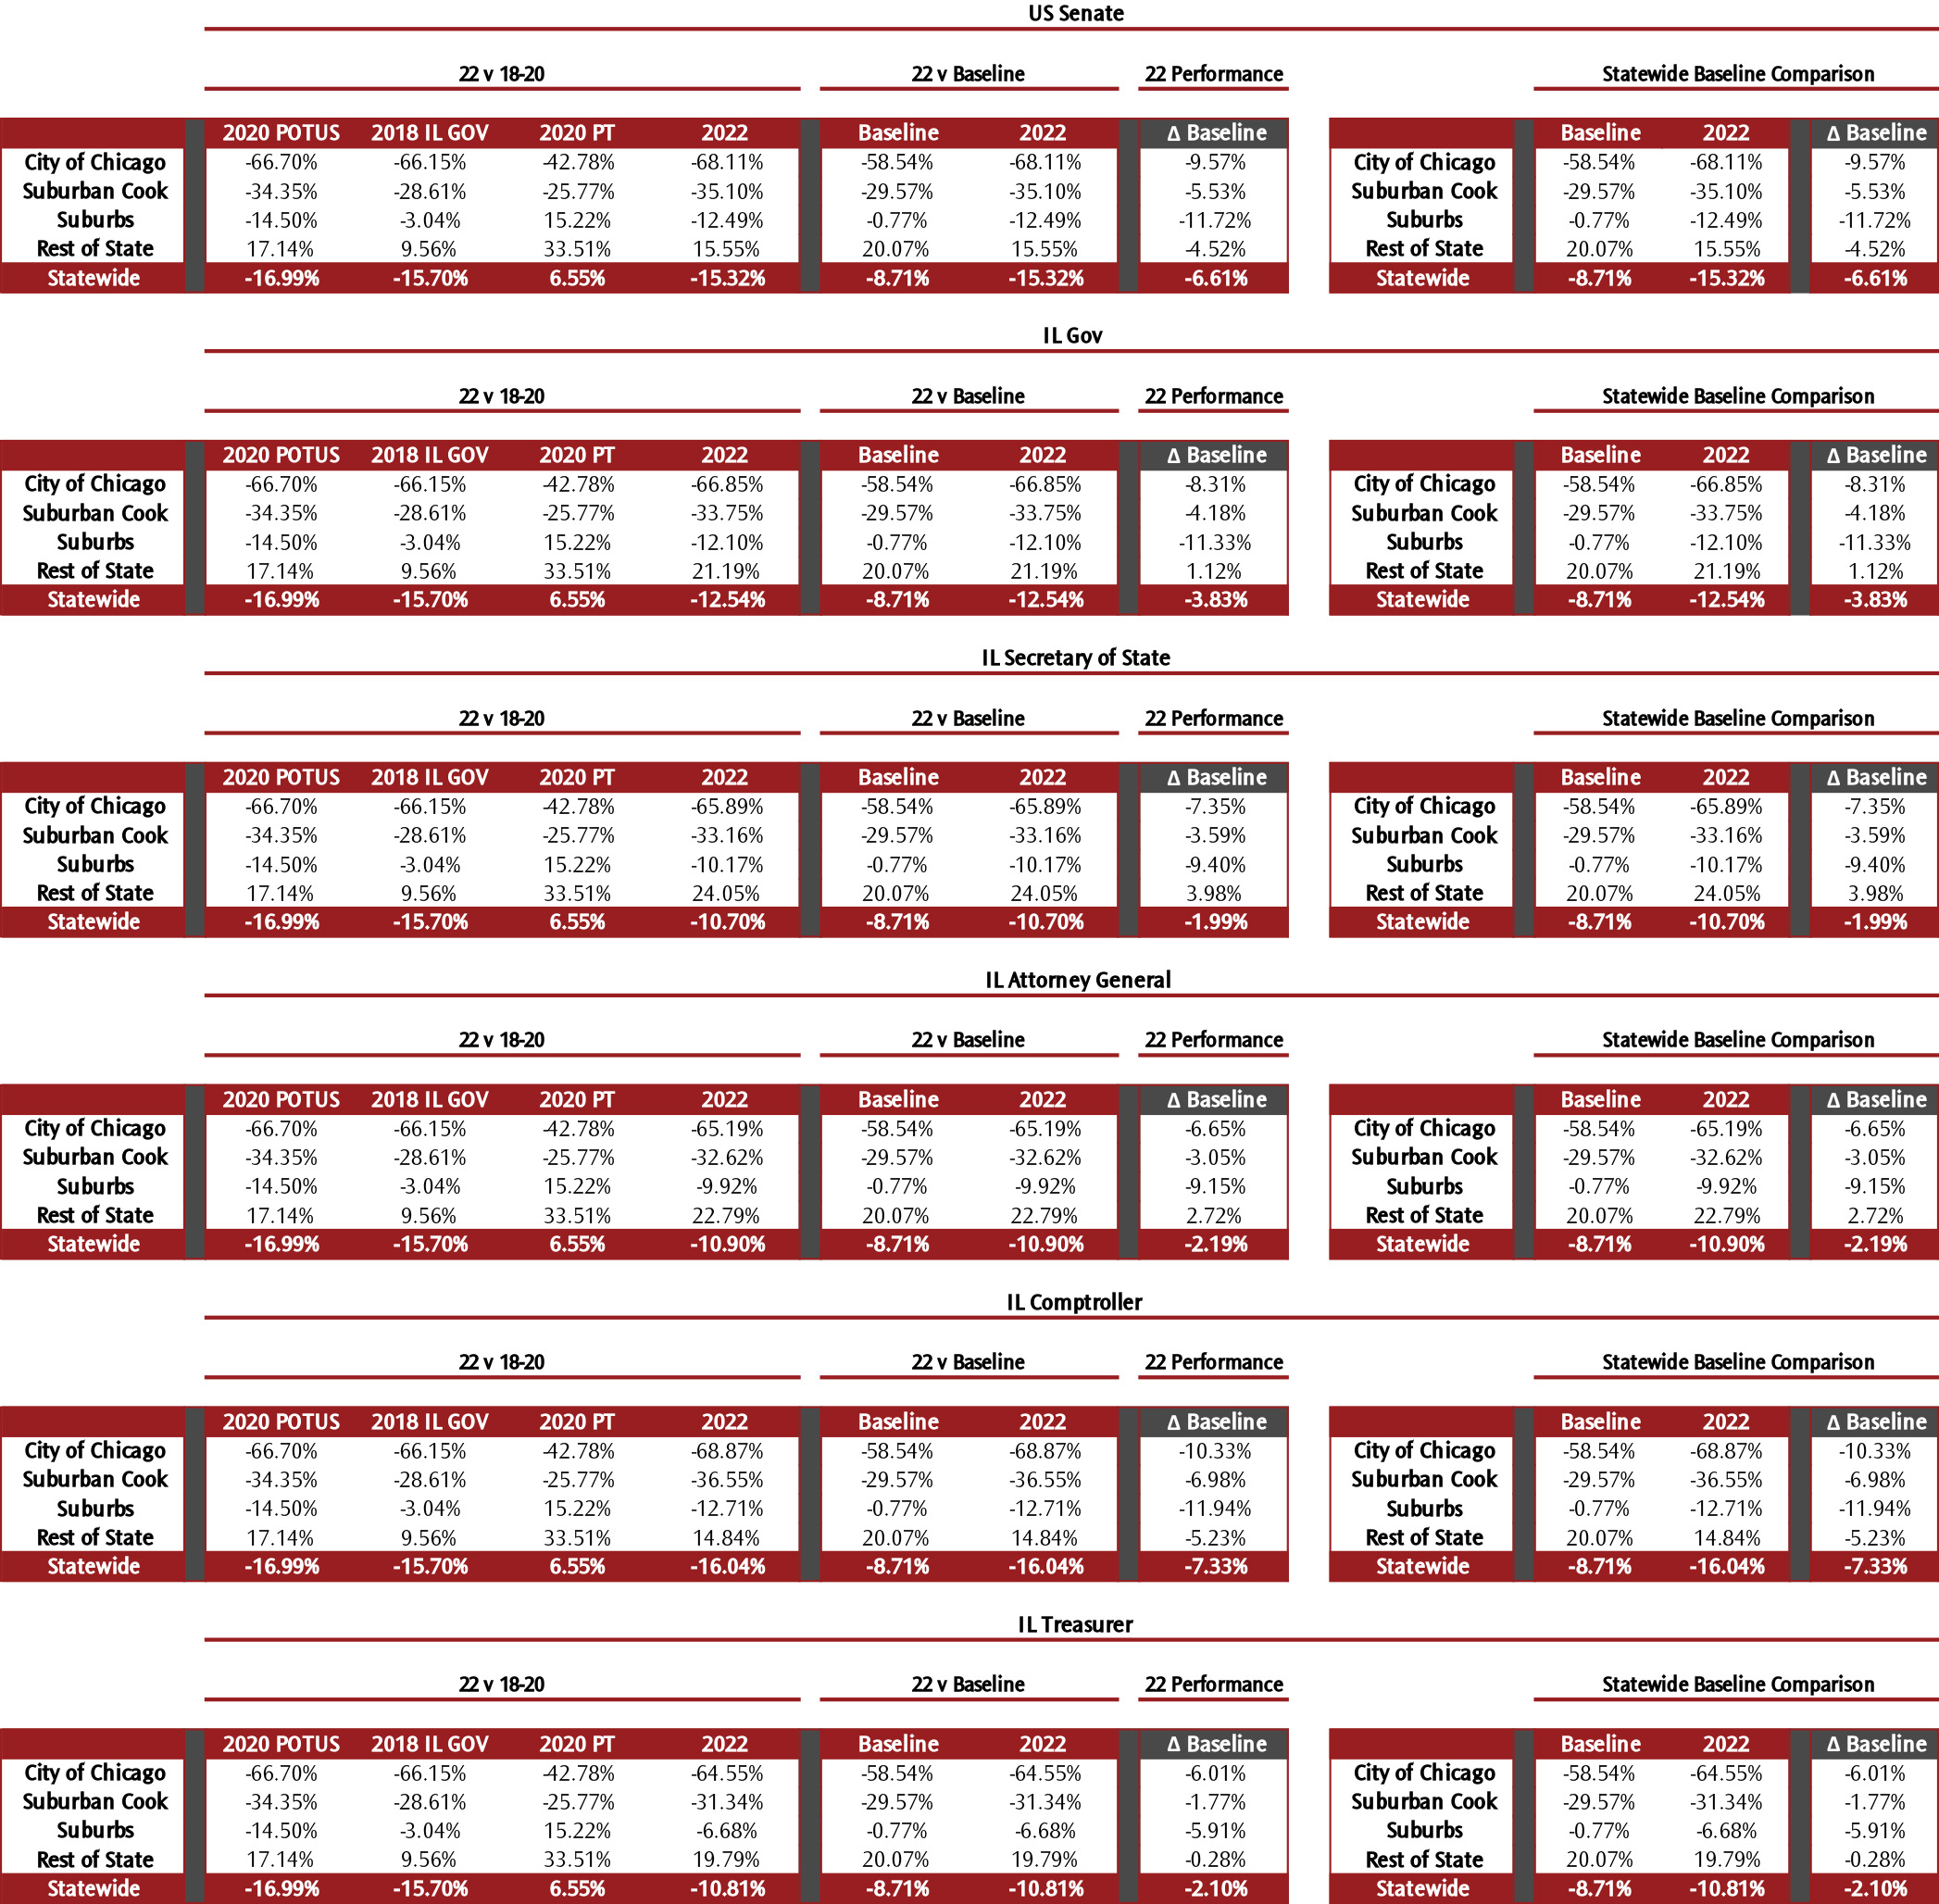
Table shows the performance of each candidate (“2022”) compared to our benchmark races in 2018 & 2020. The “Performance” column compares that candidate’s performance to the average Republican candidate performance in 2022 – a positive number indicates that candidate performed better than average, a negative number indicates that candidate performed worse than average.
US Senate - Salvi (R) vs Duckworth (D)
Region | 2020 POTUS | 2018 IL GOV | 2020 PT | 2022 | Performance |
---|---|---|---|---|---|
City of Chicago | -66.70% | -66.15% | -42.78% | -68.11% | -3.97% |
Suburban Cook | -34.35% | -28.61% | -25.77% | -35.10% | 0.07% |
Suburbs | -14.50% | -3.04% | 15.22% | -12.49% | -6.12% |
Rest of State | 17.14% | 9.56% | 33.51% | 15.55% | 1.08% |
Statewide | -16.99% | -15.70% | 6.55% | -15.32% | -1.01% |
Governor - Bailey (R) vs Pritzker (D)
Region | 2020 POTUS | 2018 IL GOV | 2020 PT | 2022 | Performance |
---|---|---|---|---|---|
City of Chicago | -66.70% | -66.15% | -42.78% | -66.85% | -2.71% |
Suburban Cook | -34.35% | -28.61% | -25.77% | -33.75% | 1.42% |
Suburbs | -14.50% | -3.04% | 15.22% | -12.10% | -5.73% |
Rest of State | 17.14% | 9.56% | 33.51% | 21.19% | 6.72% |
Statewide | -16.99% | -15.70% | 6.55% | -15.32% | 1.77% |
Secretary of State - Brady (R) vs Giannoulias (D)
Region | 2020 POTUS | 2018 IL GOV | 2020 PT | 2022 | Performance |
---|---|---|---|---|---|
City of Chicago | -66.70% | -66.15% | -42.78% | -65.89% | -1.75% |
Suburban Cook | -34.35% | -28.61% | -25.77% | -33.16% | 2.01% |
Suburbs | -14.50% | -3.04% | 15.22% | -10.17% | -3.80% |
Rest of State | 17.14% | 9.56% | 33.51% | 24.05% | 9.58% |
Statewide | -16.99% | -15.70% | 6.55% | -10.70% | 3.61% |
Attorney General - DeVore (R) vs Raoul (D)
Region | 2020 POTUS | 2018 IL GOV | 2020 PT | 2022 | Performance |
---|---|---|---|---|---|
City of Chicago | -66.70% | -66.15% | -42.78% | -65.19% | -1.05% |
Suburban Cook | -34.35% | -28.61% | -25.77% | -32.62% | 2.55% |
Suburbs | -14.50% | -3.04% | 15.22% | -9.92% | -3.55% |
Rest of State | 17.14% | 9.56% | 33.51% | 22.79% | 8.32% |
Statewide | -16.99% | -15.70% | 6.55% | -10.90% | 3.41% |
Comptroller - Teresi (R) vs Mendoza (D)
Region | 2020 POTUS | 2018 IL GOV | 2020 PT | 2022 | Performance |
---|---|---|---|---|---|
City of Chicago | -66.70% | -66.15% | -42.78% | -68.87% | -4.73% |
Suburban Cook | -34.35% | -28.61% | -25.77% | -36.55% | -1.38% |
Suburbs | -14.50% | -3.04% | 15.22% | -12.71% | -6.34% |
Rest of State | 17.14% | 9.56% | 33.51% | 14.84% | 0.37% |
Statewide | -16.99% | -15.70% | 6.55% | -16.04% | -1.73% |
Treasurer - Demmer (R) vs Frerichs (D)
Region | 2020 POTUS | 2018 IL GOV | 2020 PT | 2022 | Performance |
---|---|---|---|---|---|
City of Chicago | -66.70% | -66.15% | -42.78% | -64.55% | -0.41% |
Suburban Cook | -34.35% | -28.61% | -25.77% | -31.34% | 3.83% |
Suburbs | -14.50% | -3.04% | 15.22% | -6.68% | -0.31% |
Rest of State | 17.14% | 9.56% | 33.51% | 19.79% | 5.32% |
Statewide | -16.99% | -15.70% | 6.55% | -10.81% | 3.50% |